Customer Growth Opportunities
Summary
Customer growth opportunities are visible in three places: cross-sell pairs, basket diversity, and churn recovery.
Multi-category baskets generate stronger basket revenue than single-category baskets, which suggests that encouraging customers into adjacent categories can increase basket value.
The dashboard also shows that about one-quarter of customers are marked as churned, so retention is a meaningful growth lever, not just a defensive activity.
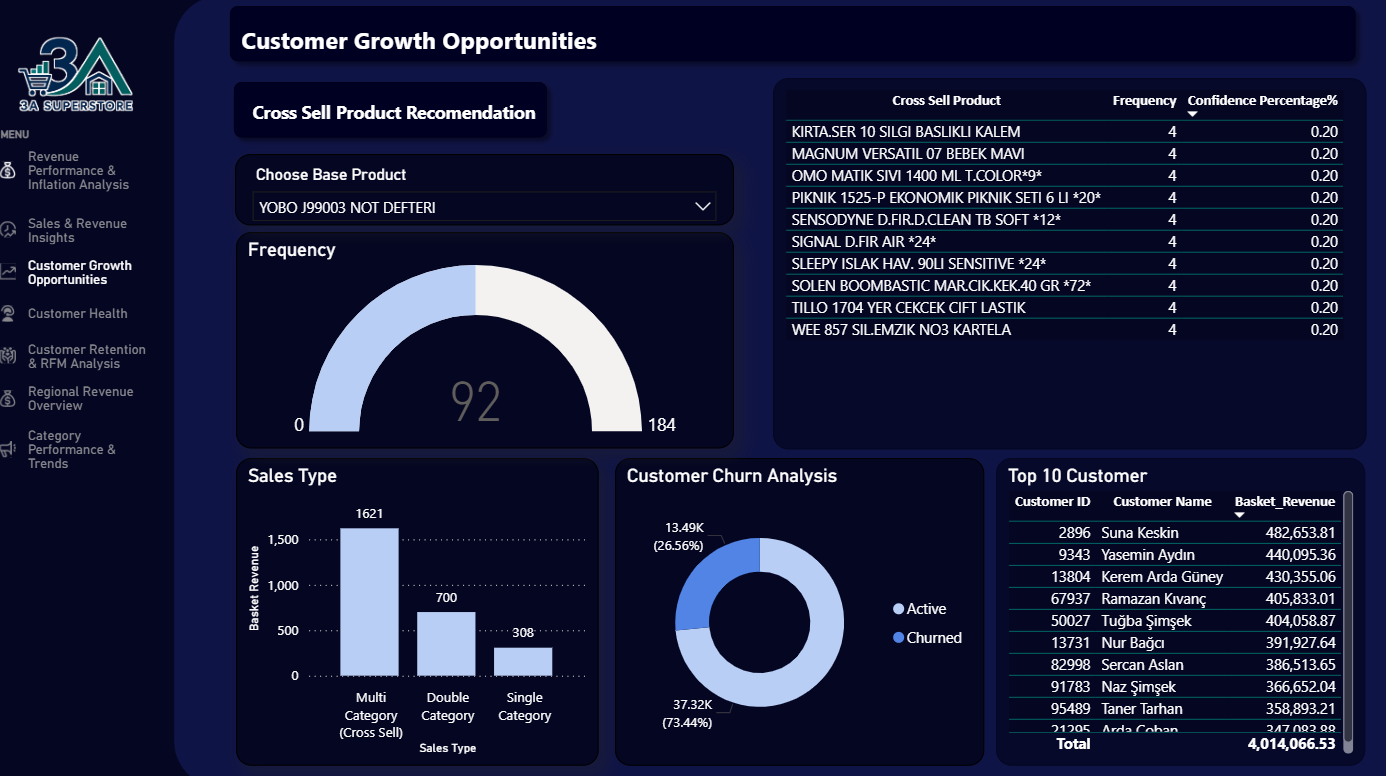
The dashboard brings together product affinity, basket diversity, churn status, and high-value customers. The goal is to identify practical ways to increase revenue from existing customer behavior.
Business Question
This analysis focuses on one customer growth question:
Which customers and baskets can be targeted to grow revenue?
To answer this, the analysis looks at which products are bought together, whether multi-category baskets produce stronger revenue, which customers are inactive, and which customers already contribute the most revenue.
What the Evidence Shows
-
Cross-sell pairs can be identified
Products bought together in the same order create candidate recommendations for bundles, promotions, or shelf placement.
-
Multi-category baskets are stronger
Multi-category purchases show the highest basket revenue in the dashboard.
-
Churn is a visible opportunity
The dashboard marks roughly 26.56% of customers as churned.
-
Top customers are worth protecting
The top customer table highlights a small group of customers with high basket revenue contribution.
Methodology
The cross-sell analysis uses order-detail data to identify products that appear together in the same basket. It starts from frequently purchased base products, pairs them with other products in the same orders, and calculates frequency and confidence to show how often a cross-sell candidate appears with the base product.
The basket and churn analysis combines orders, order details, categories, and customer records. It segments baskets by category diversity, calculates basket revenue and item counts, and marks customers as active or churned based on how long it has been since their last order.
Analysis inputs
queries/cross_sell_top_20_products.sql: finds frequently bought products, pairs them with co-purchased items, calculates combo revenue, frequency, and confidence percentage.queries/basket_customer_churn_analysis.sql: combines customer churn status with basket revenue, item quantity, and category-diversity segments.notebooks/branch_forecast_and_recommendation_system.ipynb: includes a recommendation-system section that ranks cross-sell candidates for top products.
The churn rule is intentionally simple: customers with more than 90 days since their last order are marked as churned. That makes the dashboard easy to interpret, but a future version could improve it with category-specific purchase cycles or predictive churn modeling.
Evidence Behind the Opportunities
Cross-sell pairs create practical recommendation candidates
The cross-sell logic identifies products purchased together in the same order. This makes it useful for simple recommendation ideas such as bundle tests, promotional pairings, or shelf placement.
Frequency and confidence help separate stronger co-purchase signals from weaker ones. The results should be treated as candidate opportunities to test, not as a finished recommendation engine.
Basket diversity is connected to revenue
The sales type chart shows that multi-category baskets have the strongest basket revenue signal. Double-category baskets perform better than single-category baskets, while single-category baskets contribute the least.
This suggests a clear growth lever: encourage customers who buy from one category to add related products from another category.
Churn recovery is a meaningful opportunity
The churn chart shows that about one-quarter of customers are marked as churned, while the majority remain active.
That churned group represents potential recoverable revenue. Even if not every inactive customer can be won back, identifying them gives the business a clear target for reactivation campaigns.
High-value customers need protection
The top customer table highlights the customers with the highest basket revenue. This is useful because revenue growth is not only about acquiring new customers; it is also about protecting customers who already contribute meaningful value.
High-value customers should receive more deliberate retention attention than the average customer.
Business Implications
Growth takeaway
The strongest growth opportunities come from using existing behavior more intelligently: recommend products that naturally appear together, move customers toward multi-category baskets, and recover customers who have gone inactive.
Cross-selling can increase basket value, churn recovery can protect revenue, and high-value customer monitoring can reduce avoidable revenue loss. These are practical actions that can be tested without changing the entire business model.
Recommended Actions
- Use co-purchase pairs as hypotheses for bundle tests, shelf placement, and targeted promotions.
- Encourage single-category buyers into adjacent categories to increase basket diversity.
- Build reactivation campaigns for customers marked as churned.
- Protect top customers with loyalty offers, personalized campaigns, or priority retention actions.
- Track cross-sell confidence and revenue impact after campaigns, rather than assuming every co-purchase pair will perform equally well.
- Improve the churn approach over time with predictive features such as purchase frequency, average basket value, category preference, and recency trends.